
The Top 1% in International and Historical Perspective
By Alvaredo

“The Top 1% in International and Historical Perspective” considers multiple reasons as to why there is such vast income inequality between regular citizens and the wealthiest 1% of the world who are regarded as the ‘elites’. Through this book, you begin to understand how policies can affect income inequality both positively and negatively via various economic theories which will be discussed through this blog.
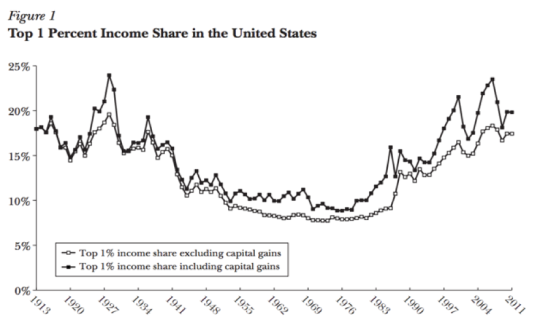
Figure 1 shows the share of total income earned by the top 1% of individuals in the USA from 1913 to 2011. Income is defined as pre-tax market income; it excludes government transfers and nontaxable fringe benefits (healthcare). The figure displays capital gains (solid squares) as well as displaying the effect on income when realized capital gains (hollow squares) is excluded.
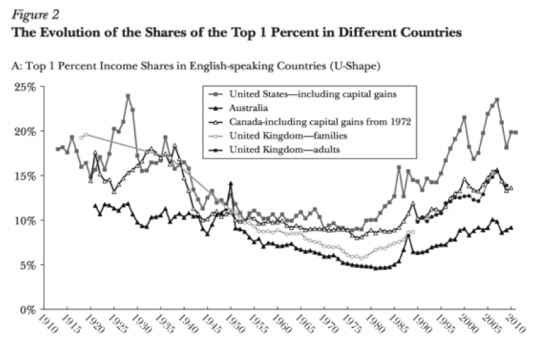
The evolution of the shares of the top 1% is shown for four Anglo-Saxon countries in Figure 2A and for France, Germany, Sweden, and Japan in Figure 2B. The Anglo-Saxon countries – Australia, Canada, and the UK all show a U-shape. Over the period 1980 to 2007, when the top 1% share rose by some 135% in the USA and the UK, it rose by some 105% in Australia and 76% in Canada). There’s a huge difference in Europe and Japan, where the long pattern of income inequality is much closer to an L-shape than a U-shaped curve. There has been some rise in recent years in the top shares in these countries, but the top 1% shares are not far from their levels in the late 1940s during WWII, whereas in the USA the share of the top 1% is higher by more than a half.
The fact that high income countries with similar technological and productivity developments have gone through different patterns of income inequality supports the view that institutional and policy differences play a key role in these transformations. Purely technology based solely upon supply and demand can hardly explain such different patterns. We have to understand not only why top shares rose (in the U-shaped countries) but also why they fell for a period of time earlier in the 20th century. This comes down to the most obvious policy difference between countries – taxation.
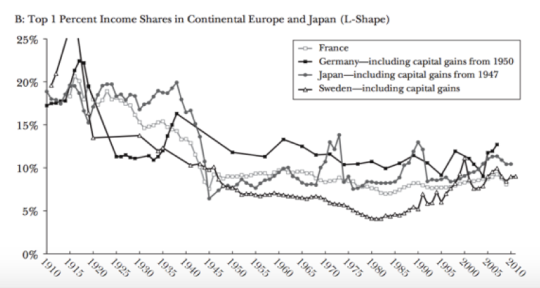
Figure 3 depicts the top marginal statutory individual income tax rate applying to ordinary income in the USA, UK, France, and Germany since 1900.
During the 20th century, top income tax rates have followed an inverse U-shaped path in many countries, as illustrated in Figure 3. In the USA, top income tax rates were consistently above 60% from 1932 to 1981, and at the start of the 1920s, they were above 70%. High income tax rates were a feature of post-WWII and their cumulative effect contributed to the earlier decline in top income shares. While many countries have cut top tax rates in recent decades, the depth of these cuts has varied considerably. For example, the top tax rate in France in 2010 was only 10% lower than in 1950, whereas the top tax rate in the USA is less than half its 1950 value which ultimately explains the U-shaped graph depicting the top 1% of USA citizens whilst France has a L-shape.
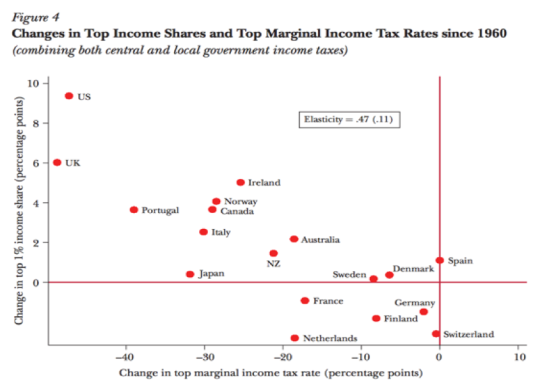
Figure 4 plots the changes in top marginal income tax rates since the early 1960s against the changes over that period in the top 1% income shares for 18 high income countries. It shows that there is a strong correlation between the reductions in top tax rates and the increases in top 1 percent pre-tax income shares. For example, the USA experienced a reduction of 47% in its top income tax rate and a 10% increase in its top 1% pre-tax income share. By contrast, countries such as Germany, Spain, or Switzerland, which did not experience any significant top rate tax cut, did not show increases in top 1% income shares. Hence, the evolution of top tax rates is strongly negatively correlated with changes in pre-tax income concentration.
However, it can be argued that there has not actually been any real increase in income concentration but rather because top tax rates heavily decreased, there is now less of an incentive to tax avoid and therefore it merely appears that there has been an increase in the top 1% of income in the USA. Under this scenario, the real USA top income shares were as high in the 1960s as they are today because during the 1960s, a smaller fraction of top incomes were reported on tax returns.
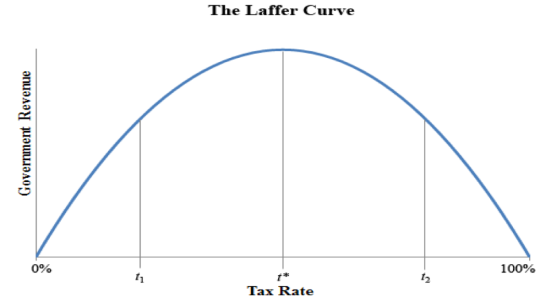
The USA decreased top bracket tax rates under the belief that it will lead to behavioral changes of individuals of the top 1%. The idea derives from a supply side policy whereby lower tax rates stimulate economic activity through the increase in discretionary income and therefore consumption among top earners as well as involving more work and greater entrepreneurship which would lead to more economic activity by the rich and hence more economic growth.
However, there are no apparent aggregate outcomes in correlation between cuts in top tax rates and growth rates in real GDP per capita. Countries that made large cuts in top tax rates such as the UK and the USA have not grown significantly faster than countries that did not, such as Germany or Switzerland. This lack of correlation is more consistent with the idea that from tax decreases, there is more individualised pay at the top, rather than increased productive effort.
Capital income consists of rents, dividends, interest, and realised capital gains. The decline of top capital incomes is the main driver of the falls in top income shares that occurred in many countries early in the 20th century. For example, from 1916 to 1939, capital income represented 50% of US top 1% incomes, whereas by the end of the century from 1987 to 2010, the share had fallen to one third. In the UK, the corresponding share fell from 60% in 1937 to under 20% by the end of the century.
Conclusively, in seeking explanations for the rise in top income shares, it would be reductive to focus just on the doubling of the share of income going to the top 1% of the US over the past 40 years. We also have to account for the fact that a number of high income countries have seen more modest or little increase in top shares. Hence, the explanation cannot rely solely on common advances in countries such as innovation of new technology. Moreover, the explanations have to consider the falls in top income shares earlier in the 20th century. Therefore, the varying levels of dominance of the top 1% across different countries must ultimately come down to the difference in economic and political policy implemented by the various governments.
Discuss this article